


The Pound to New Zealand Dollar exchange rate appears to have been locked in a sideways-orientated range during most of June and July, but last week it decisively broke lower.
The move came as a surprise given lower-than-expected New Zealand inflation data out last week reinforced the Reserve Bank of New Zealand’s commitment to its current historically low settings on interest rates, and its desire to see a weaker currency.
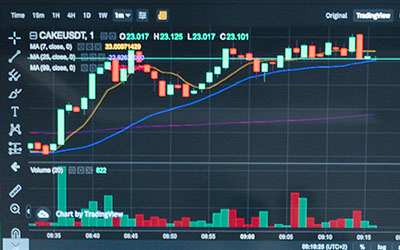
From a technical perspective, GBP/NZD has fallen for four straight days and reached lows in the 1.74s from the 1.78 zone it was previously in, and it is expected to continue lower.
The pair has roughly described an Elliot Wave pattern in its move down since the May 1.88 highs.
Elliot Waves are patterns composed of 5 waves as illustrated on the chart below, which shows the proposed Elliot Wave on GBP/NZD.
If correct it means the pair is in the fifth and final wave down.
The fifth wave should reach as far down as the trough of the third wave at 1.7335, as a bare minimum.
A break below the 1.7406 lows would confirm a continuation down to the aforesaid 1.7335 minimum target.
Trendline A, situated in the 1.73s, is likely to provide an obstacle to further loses and is a further reason for expecting the pattern down to possibly end and correct at that level.
Get up to 5% more foreign exchange by using a specialist provider. Get closer to the real market rate and avoid the gaping spreads charged by your bank for international payments. Learn more here.
The Trade balance, which is the difference between imports and exports, will be released at 23.45 on Tuesday, July 25.
It is expected to fall to 100 million in June from 103 million in May, however, the chart below shows the potential for even greater loss.
The chart of the historical Trade Balance shows the data moves in clear cycles and it is currently in a downcycle.
The first set of estimates for growth in the second quarter are released on Wednesday July 26 at 9.30 BST, and are likely to be the most significant release for the Pound in the week ahead.
They are currently expected to show a slightly slower 1.7% rise in GDP in Q2 compared to a 2.0% rise at the same time last year (in Q2 in 2016).
Such a result will pull growth down to the lower boundary of the current GDP growth rate range.
Quarter-on-quarter, growth in Q2 is likely to be 0.3% higher than it was in Q1, when it was only 0.2%.
The other release of note is Mortgage Approvals in June, from the British Banking Association (BBA).
These are also out at 9.30 on Wednesday July 23.
Mortgage Approvals have been oscillating in a subdued range for years since the great recession as illustrated in the graph below.
They have, however, formed an interesting triangle pattern over the last few years which provides clues of what might happen next.
Triangles almost always a precursor of periods of high volatility, and although we can’t tell which way the volatility will extend, it is highly probable there will be either a large swift spike higher or lower in the data.
The triangle has probably almost finished as it has formed 5 component waves - a,b,c,d,e - which is the minimum number to prove completion.
For confirmation, we would be looking for a move above 47,500 in an upside break; or below 37,000 in a downside break.
Using the height of the triangle at its widest as a guide we forecast a post-break volatile spike of about 8,000 -12,000 approvals higher or lower, so assuming the previously mentioned levels are breached, the upside target is 55k level and the downside 30k.
Given housing is such a key leading indicator for the economy this may be a key early warning for the general health of the economy going forward and thus the Pound.
A spike lower in approvals would probably drag down Sterling and vice versa for a spike higher.


 zpostcode
 Recruit
 weather
 mreligion
 Yellowpages
 sport
sport constellation
 shopping
 name
name game
game directory
 literature
 Word
Word tour
tour furnish
 Lottery
 tftnews
 lyrics
 News
News digital
 car
car dir
dir Edu
Edu Finance


