financetom
Cryptocurrency
financetom
/
Cryptocurrency
/
Ripple Price Analysis: XRP Could Plunge to $1.6 if This Support Fails
News World Market Environment Technology Personal Finance Politics Retail Business Economy Cryptocurrency Forex Stocks Market Commodities
Ripple Price Analysis: XRP Could Plunge to $1.6 if This Support Fails
Feb 28, 2025 6:24 AM

Ripple’s price is experiencing a significant decline, alongside the whole crypto market, and is likely to continue dropping lower if Bitcoin fails to recover soon.

By Edris Derakhshi (TradingRage)

The USDT Paired Chart

On the daily chart of the XRP/USDT pair, the price has been trending lower following the rejection from the $3 resistance zone earlier in January.

Currently, the market is testing the $2 support level, and if a breakdown occurs, a further decline toward the 200-day moving average, located around the $1.6 mark, would be probable. Yet, with the RSI entering the oversold region, a consolidation or at least a bullish pullback could be expected in the coming weeks.

The BTC Paired Chart

Looking at the XRP/BTC pair, it is evident that Ripple is holding on better against Bitcoin, as the price has not experienced a considerable drop. Yet, this is mainly because BTC itself is currently experiencing a massive move lower.

Nevertheless, the 2000 SAT support level will likely be the upcoming XRP target, as the RSI is showing clear bearish momentum. The long-term outlook for XRP, however, will mostly depend on whether it is able to keep above the 200-day moving average, currently trending around the 1700 SAT area.

SPECIAL OFFER (Sponsored) Binance Free $600 (CryptoPotato Exclusive): Use this link to register a new account and receive $600 exclusive welcome offer on Binance (full details).

LIMITED OFFER for CryptoPotato readers at Bybit: Use this link to register and open a $500 FREE position on any coin!

Disclaimer: Information found on CryptoPotato is those of writers quoted. It does not represent the opinions of CryptoPotato on whether to buy, sell, or hold any investments. You are advised to conduct your own research before making any investment decisions. Use provided information at your own risk. See Disclaimer for more information.

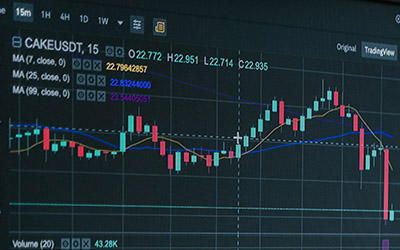
Cryptocurrency charts by TradingView.

Comments
Welcome to financetom comments! Please keep conversations courteous and on-topic. To fosterproductive and respectful conversations, you may see comments from our Community Managers.
Sign up to post
Sort by
Show More Comments
Related Articles >
Metaplanet’s Bitcoin Stash Reaches $40.6 Million After Latest Purchase
Oct 7, 2024
Tokyo-listed Bitcoin holder Metaplanet has purchased an additional 108.786 Bitcoin for 1 billion yen, reflecting its ongoing bullish stance on the crypto asset. The latest stash is worth around $6.7 million. Metaplanet Expands Bitcoin Holdings According to the official statement released on Monday, Metaplanet often referred to as Japan’s MicroStrategy now holds 639.503 BTC, with a current market value of...
Mantra (OM) Price Hits a New ATH: Further Rally in the Cards?
Oct 7, 2024
TL;DR Mantra (OM) surged over 60% in the past 30 days, hitting an all-time high of $1.50 with analysts predicting a further jump. On-chain metrics suggest continued gains, but the RSI indicates it may be overbought, signaling a possible correction. New Peak for OM Most of the leading cryptocurrencies have experienced severe ups and downs over the past several weeks....
Ripple Price Analysis: Is XRP Headed for a Drop to $0.5?
Oct 7, 2024
Ripple’s price has recently experienced a significant decline, just as market participants were becoming optimistic about the beginning of a new bullish run. By Edris Derakhshi (TradingRage) The USDT Paired Chart Against USDT, the XRP price broke above the $0.6 resistance level last week. Unfortunately,, it failed to hold above, and it crashed rapidly below the level and the 200-day...
Ethereum Price Analysis: ETH Flirts With $2.5K But Bullish Prospects Remain Questionable
Oct 7, 2024
Ethereum’s price has been consolidating in a wide range above the $2,000 mark. Yet, things might change soon. Technical Analysis By Edris Derakhshi (TradingRage) The Daily Chart On the daily chart, the price has been moving sideways in a $500 range between the $2,700 resistance level and the $2,200 support zone. With the market testing the upper boundary multiple times...
Copyright 2023-2025 - www.financetom.com All Rights Reserved