


Ethereum’s price has been on a gradual decline since mid-March and has yet to show any decisive sign of recovery.
Yet today’s price action is critical, as it can finally bring back some bullish momentum to the market.
By TradingRage
Looking at the daily timeframe, Ethereum’s price has been trending lower inside a large descending channel and is yet to break it to either side.
Meanwhile, the cryptocurrency is currently testing the midline of the range and the key $3,000 level. With the 200-day moving average located near the $2,800 support zone, the market seems more likely to rally higher toward the $3,600 resistance zone in the coming weeks.
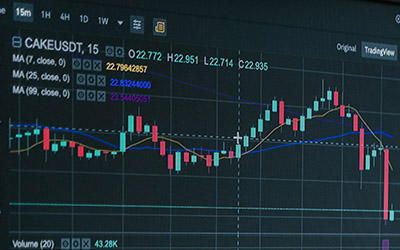
Source: TradingView
The 4-hour chart paints a more clear picture. Ethereum’s price has been rapidly rising since yesterday, but it is currently being held by the midline of the channel and the $3,000 resistance level.
Meanwhile, the RSI is showing values above 50% at the moment, indicating that the momentum is in favor of the buyers. Therefore, a breakout above the midline of the channel could lead to a quick rally toward the $3,600 resistance area.
Source: TradingView
By TradingRage
Ethereum’s price has been following a downward trajectory since its rejection from the $4,000 level. Meanwhile, analyzing the markets supply and demand dynamics can yield important information.
This chart presents the Exchange Reserve metric and its 30-day moving overage for Ethereum. Rising values are typically associated with an increase in selling pressure, as they usually indicate that the deposits are being exchanged by holders who want to sell their coins.
As the chart demonstrates, the exchange reserve metric has been experiencing an overall decline during the last few months. However, the metric has recently broken above its moving average, a sign that unusual selling has previously materialized during price drops or reversals. Therefore, investors should be hopeful that the supply will be met with sufficient demand, or things could get ugly soon.
Source: CryptoQuant SPECIAL OFFER (Sponsored) Binance Free $600 (CryptoPotato Exclusive): Use this link to register a new account and receive $600 exclusive welcome offer on Binance (full details).
LIMITED OFFER 2024 for CryptoPotato readers at Bybit: Use this link to register and open a $500 BTC-USDT position on Bybit Exchange for free!
Disclaimer: Information found on CryptoPotato is those of writers quoted. It does not represent the opinions of CryptoPotato on whether to buy, sell, or hold any investments. You are advised to conduct your own research before making any investment decisions. Use provided information at your own risk. See Disclaimer for more information.
Cryptocurrency charts by TradingView.


 zpostcode
 Recruit
 weather
 mreligion
 Yellowpages
 sport
sport constellation
 shopping
 name
name game
game directory
 literature
 Word
Word tour
tour furnish
 Lottery
 tftnews
 lyrics
 News
News digital
 car
car dir
dir Edu
Edu Finance


