


Ripple is currently experiencing a phase of low volatility, with its price fluctuating within the pivotal $2-$3 range. This consolidation period suggests market indecision, with a breakout likely to define XRPs next mid-term trend.
By Shayan
Ripple’s price has recently been confined within the $2-$3 range, characterized by low volatility and muted trading activity. This consolidation reflects a cautious market state as participants await a definitive breakout to signal the next directional move.
Currently, the cryptocurrency is anchored at the $2 support zone, a level bolstered by historical significance as a prior swing high and a concentration of demand. It is acting as a crucial barrier, halting further downside movement and keeping Ripple within its consolidation range.
Adding to the bullish outlook, the RSI indicator has stabilized near 50, indicating equilibrium between buyers and sellers. This positioning creates a foundation for bullish momentum, with the potential for a breakout above the $3 resistance. If this materializes, Ripple could embark on a mid-term upward trend.
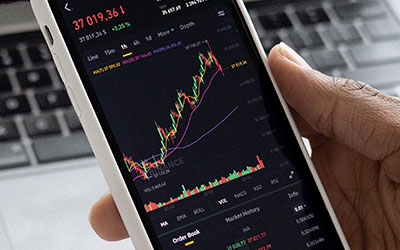
Source: TradingView
On the 4-hour timeframe, Ripple has been fluctuating within a descending wedge pattern, a formation typically associated with bullish breakouts.
The price is testing the wedge’s lower boundary near the critical $2 support zone, where heightened buying activity is expected. This zone is further reinforced by the significant 0.5 ($2)-0.618 ($1.9) Fibonacci retracement levels, underscoring its importance as a robust support area.
In the mid-term, the cryptocurrency is expected to sustain its consolidation within the wedge while holding above these key Fibonacci levels. A bullish breakout above the wedge’s upper boundary could propel the price toward the $3 resistance, setting the stage for further advances.
Conversely, failure to hold the $2 support may result in a bearish breakdown, potentially driving the price toward the $1.5 threshold, representing the next critical support level.
Source: TradingView SPECIAL OFFER (Sponsored) Binance Free $600 (CryptoPotato Exclusive): Use this link to register a new account and receive $600 exclusive welcome offer on Binance (full details).
LIMITED OFFER for CryptoPotato readers at Bybit: Use this link to register and open a $500 FREE position on any coin!
Disclaimer: Information found on CryptoPotato is those of writers quoted. It does not represent the opinions of CryptoPotato on whether to buy, sell, or hold any investments. You are advised to conduct your own research before making any investment decisions. Use provided information at your own risk. See Disclaimer for more information.
Cryptocurrency charts by TradingView.


 zpostcode
 Recruit
 weather
 mreligion
 Yellowpages
 sport
sport constellation
 shopping
 name
name game
game directory
 literature
 Word
Word tour
tour furnish
 Lottery
 tftnews
 lyrics
 News
News digital
 car
car dir
dir Edu
Edu Finance


