


Bitcoin is currently navigating a pivotal support zone, signaling potential market recovery.
Elevated volatility is anticipated in the mid-term, potentially paving the way for a breakout above the midline of its multi-month ascending channel.
By Shayan
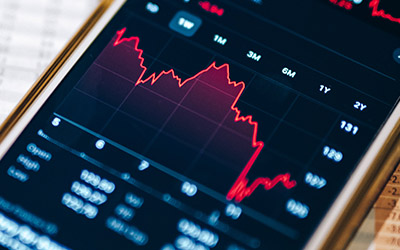
After a recent market downturn, Bitcoin dipped to the critical $90K support level before rebounding swiftly above the 100-day moving average at $94K. This movement suggests a phase of market stabilization, likely shaking out over-leveraged futures positions and setting the stage for renewed buying pressure. Currently, BTC is demonstrating signs of recovery at this crucial moving average.
However, price action remains constrained between the 100-day MA and the middle trendline of the ascending channel, making an impending breakout likely. If BTC successfully clears this key resistance, a push toward the $108K swing high could follow. Otherwise, further consolidation and fluctuations should be expected.
On the lower timeframe, Bitcoins sharp rebound from the $90K support zone highlights strong demand at this critical price level, which has acted as a firm defense line for bulls over the past few months. However, the asset is currently hovering near the $94K region, aligning with the 100-day MA.
In the mid-term, an upward retracement is expected, potentially setting the stage for a new all-time high, though temporary corrections and consolidations may occur along the way. Broadly speaking, Bitcoin remains confined between the $108K static resistance and the dynamic lower boundary of the ascending channel at $92K, with a decisive breakout dictating the next major trend direction.
By Shayan
During Bitcoin’s bullish cycles, one of the key drivers fueling price surges has been the reduction in available supply. This trend is clearly reflected in the exchange reserve chart, which tracks the amount of BTC held on trading platforms.
As shown in the chart, Bitcoin’s exchange reserves have been on an aggressive decline, signaling an accumulation phase by investors. This suggests that market participants are withdrawing their BTC from exchanges and moving them into self-custody, reducing the circulating supply available for trading.
Given that exchange reserves serve as a supply-side indicator, this persistent decline could contribute to further price appreciation in the coming weeks.
SPECIAL OFFER (Sponsored) Binance Free $600 (CryptoPotato Exclusive): Use this link to register a new account and receive $600 exclusive welcome offer on Binance (full details).
LIMITED OFFER for CryptoPotato readers at Bybit: Use this link to register and open a $500 FREE position on any coin!
Disclaimer: Information found on CryptoPotato is those of writers quoted. It does not represent the opinions of CryptoPotato on whether to buy, sell, or hold any investments. You are advised to conduct your own research before making any investment decisions. Use provided information at your own risk. See Disclaimer for more information.
Cryptocurrency charts by TradingView.


 zpostcode
 Recruit
 weather
 mreligion
 Yellowpages
 sport
sport constellation
 shopping
 name
name game
game directory
 literature
 Word
Word tour
tour furnish
 Lottery
 tftnews
 lyrics
 News
News digital
 car
car dir
dir Edu
Edu Finance


